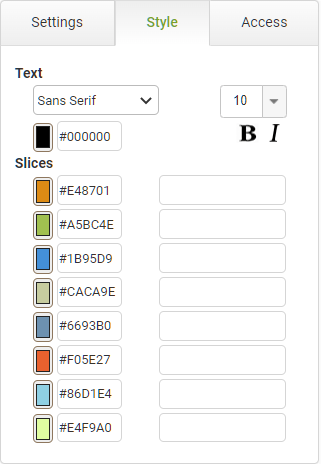
Pie Chart Settings
|
Object
|
Details
|
Additional Information
|
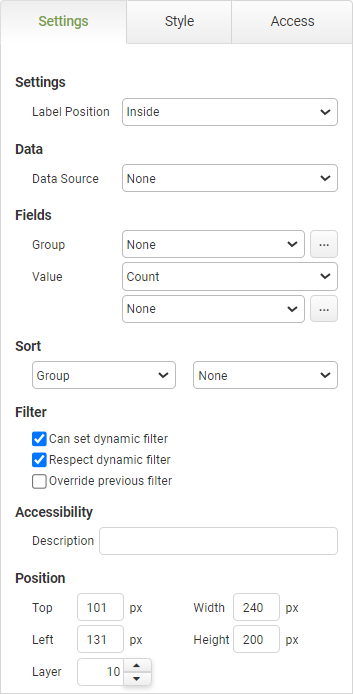
Label Position
|
Specifies where the labels appear relative to the pie chart.
|
Choose from:
None, Outside, Call-Out, Inside or Inside with Call-Out.
|
Data Source
|
Data Source
|
All reporting objects must point to a data source. If you only have defined one then this will be automatically selected.
|
|
|
Although you can have multiple data sources in a report each reporting object can only point to a single data source.
|
|
Fields
|
Group [Field]
|
This is the underlying app field (or expression) that you want to group your results by. You can either select a single field from the drop-down list or click the ellipses  ... button to define a more complex expression to evaluate. ... button to define a more complex expression to evaluate.
|
Select from any of the fields selected in the data source.
|
Value
|
The value drop down is the function used to generate the statistical result. In some cases, this will be Count as you often want to chart the number of each response to a question.
|
Choose from:
Count, Sum, Average, Minimum, Maximum, Standard Deviation, Population Standard Deviation, Variance, Population Variance.
|
|
The statistical options (all except Count) can only be applied to numeric data.
|
|
[Value - Field]
|
Below the value drop-down is the field selection. Use this to indicate the field from which the data in the chart will come. In some cases, for the pie chart, this will be the same field or expression as you used for the Group property.
|
|
|
To display the total cost of orders by department, select the Department as the Group field selection, Sum as the value drop-down, and Cost as the value field.
|
|
Sort
|
Group / Value
|
Determines the order in which the pie slices are arranged. They can be sorted by the Group object or by the Value.
|
|
None / Ascending / Descending
|
Determines the order displayed in ascending or descending order or, if none is selected, then the default order set by the system.
|
|
Filter
|
Can set dynamic filter
|
This means that a selection within the object causes the filter event to be broadcast to other objects within the report that have the Respect Dynamic Filter set.
|
|
|
Multiple dynamic filters are applied with the AND or the OR operator depending on the selection made in the data source.
|
|
Respect dynamic filter
|
Causes the object to listen to any drill-down filter that is caused by the user clicking on a report object that has the Can Set Dynamic Filter option selected. If you do not want the object to filter its data when the drill-down occurs then turn off this property.
|
|
Override previous filter
|
By default, each object that you click on for a drill-down filter remains in effect when subsequent objects are selected. In other words, the drill-downs you select are cumulative. However, you may want a drill-down selection to clear all other existing drill-down filters before performing its own drill-down. In this case, you would check the Override Previous box.
|
|
Accessibility
|
Description
|
Enter text that will be read aloud or converted to Braille for JAWS users.
|
Accessibility and JAWS Compatibility
|
Position
|
Top
|
Displays the object's location in from the top of the app (in pixels).
|
|
Left
|
Displays the object's location in from the left margin of the app (in pixels).
|
|
Width
|
Shows the width of the object.
|
The width cannot be less than 100px.
|
Height
|
Shows the height of the object.
|
The height cannot be less than 150px.
|
Layer
|
Indicates the layer number this object occupies. You can drag an object so that it fully or partially covers another object. Depending on the layer number it occupies, it may be positioned underneath another other object.
|
|


 ... button to define a more complex expression to evaluate.


